Data Collection and Exploratory Data Analysis
Introduction
This project replicates professional data analysis on a topic of current interest (influenza), and extending the analysis to include another public data source (twitter). I have replicated the data analysis graph and heatmap by CDC on real flu data. Further, I have collected 20000 tweets regarding the keyword "flu", "influenza" and "fever" using Twitter Restful API, filter out the retweets which serve as the other public data source and grouped tweets according to the geolocation to represent the outbreak of influenza using heatmap. Also, built a responsive web app using Shiny in R to publish the results. The flu data used in this project corresponds to the United States of America.
Shiny App
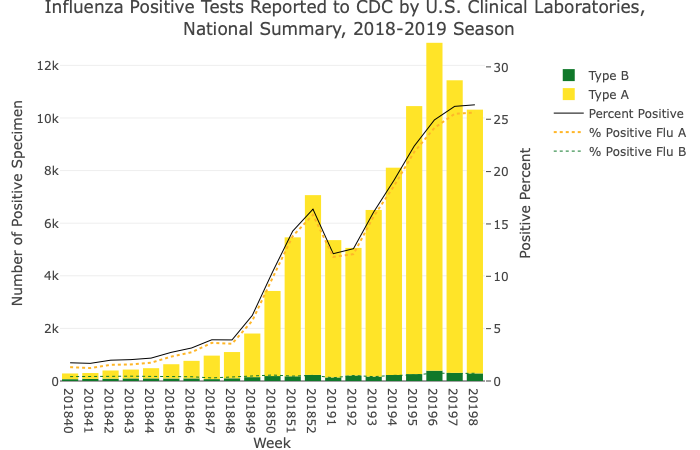
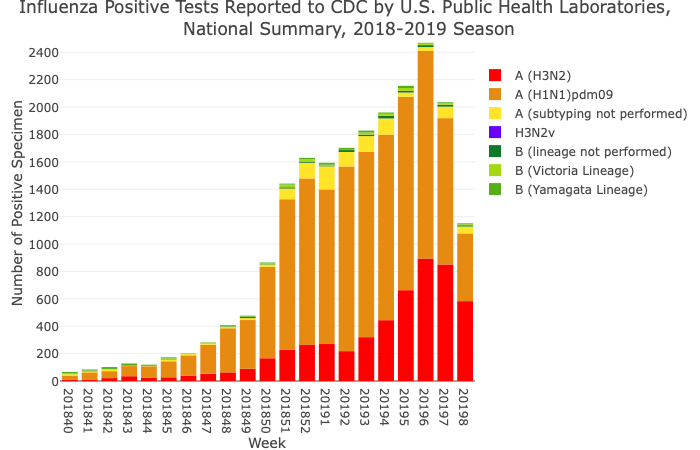
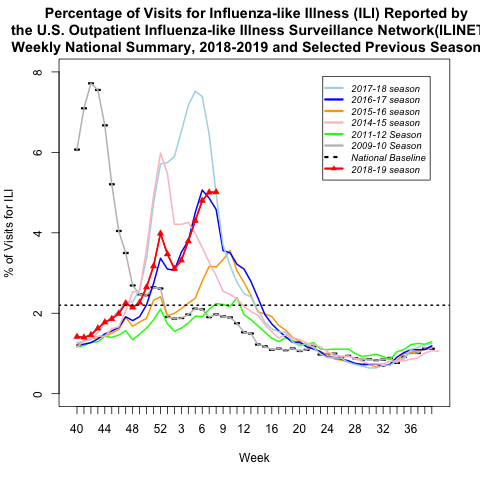
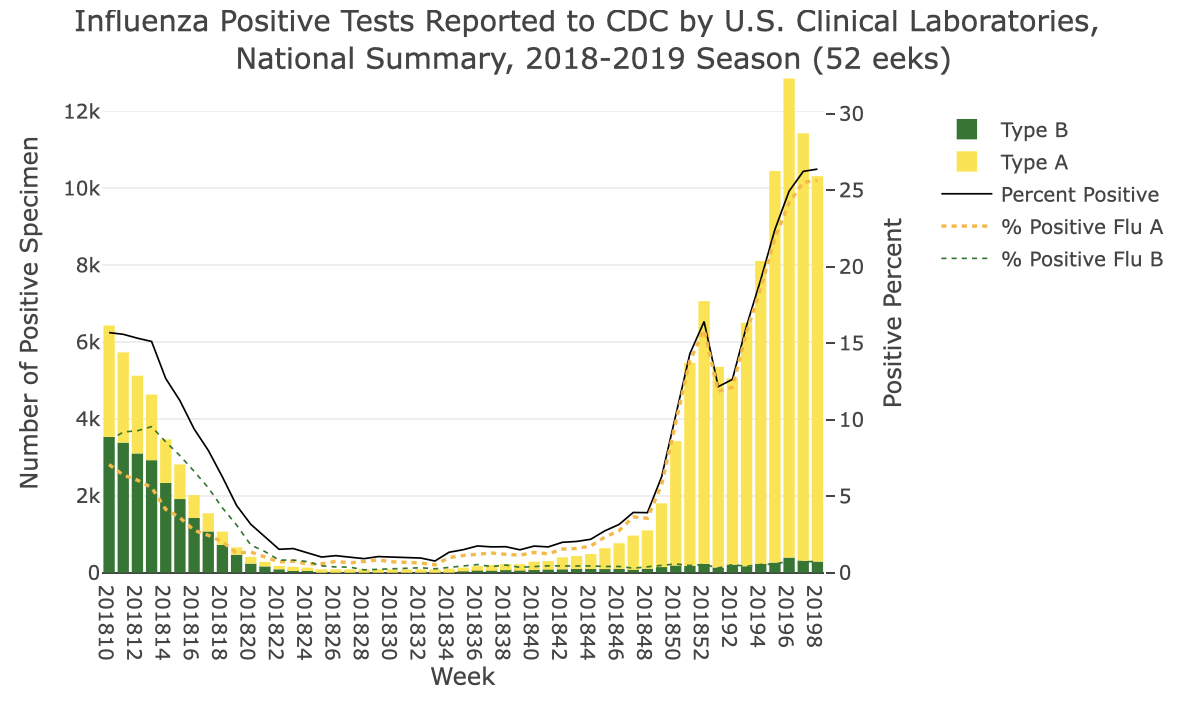
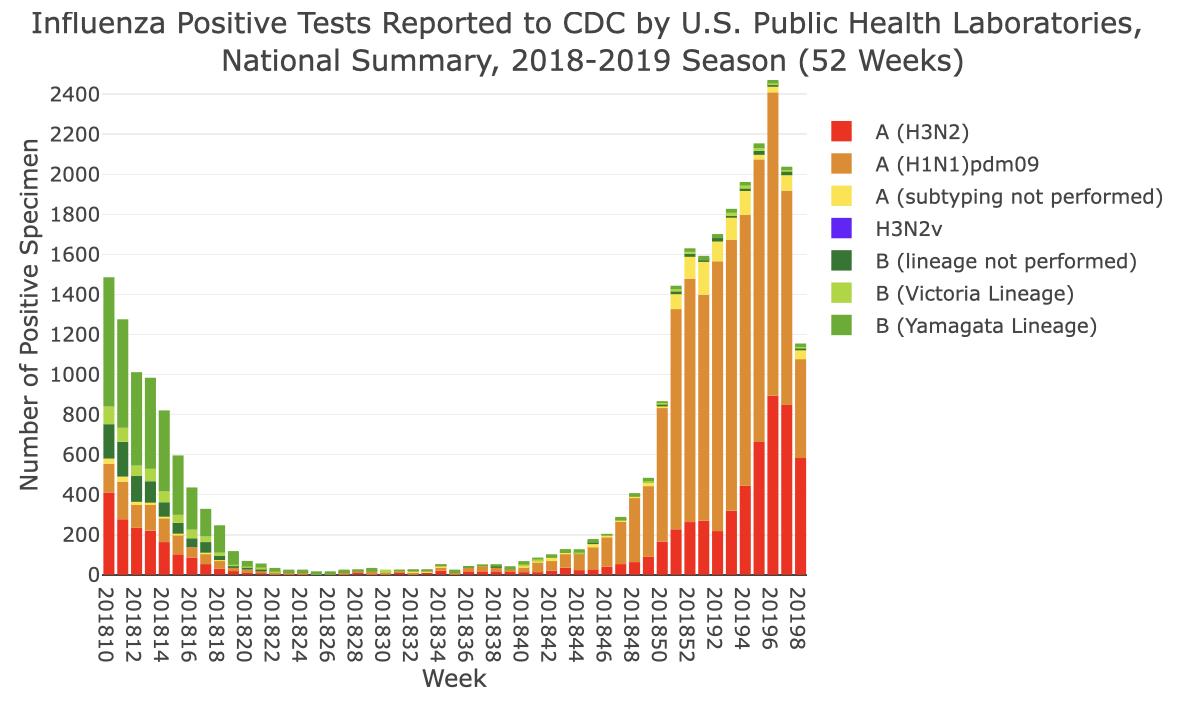
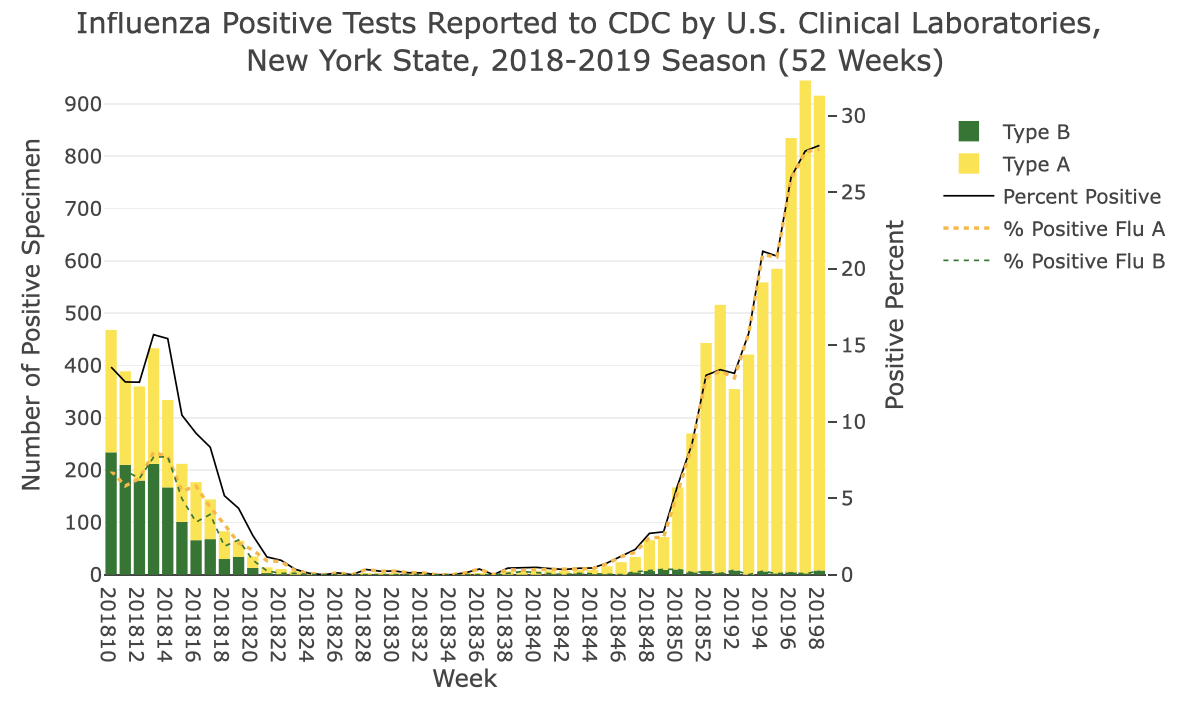
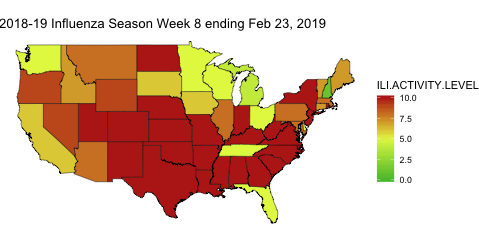
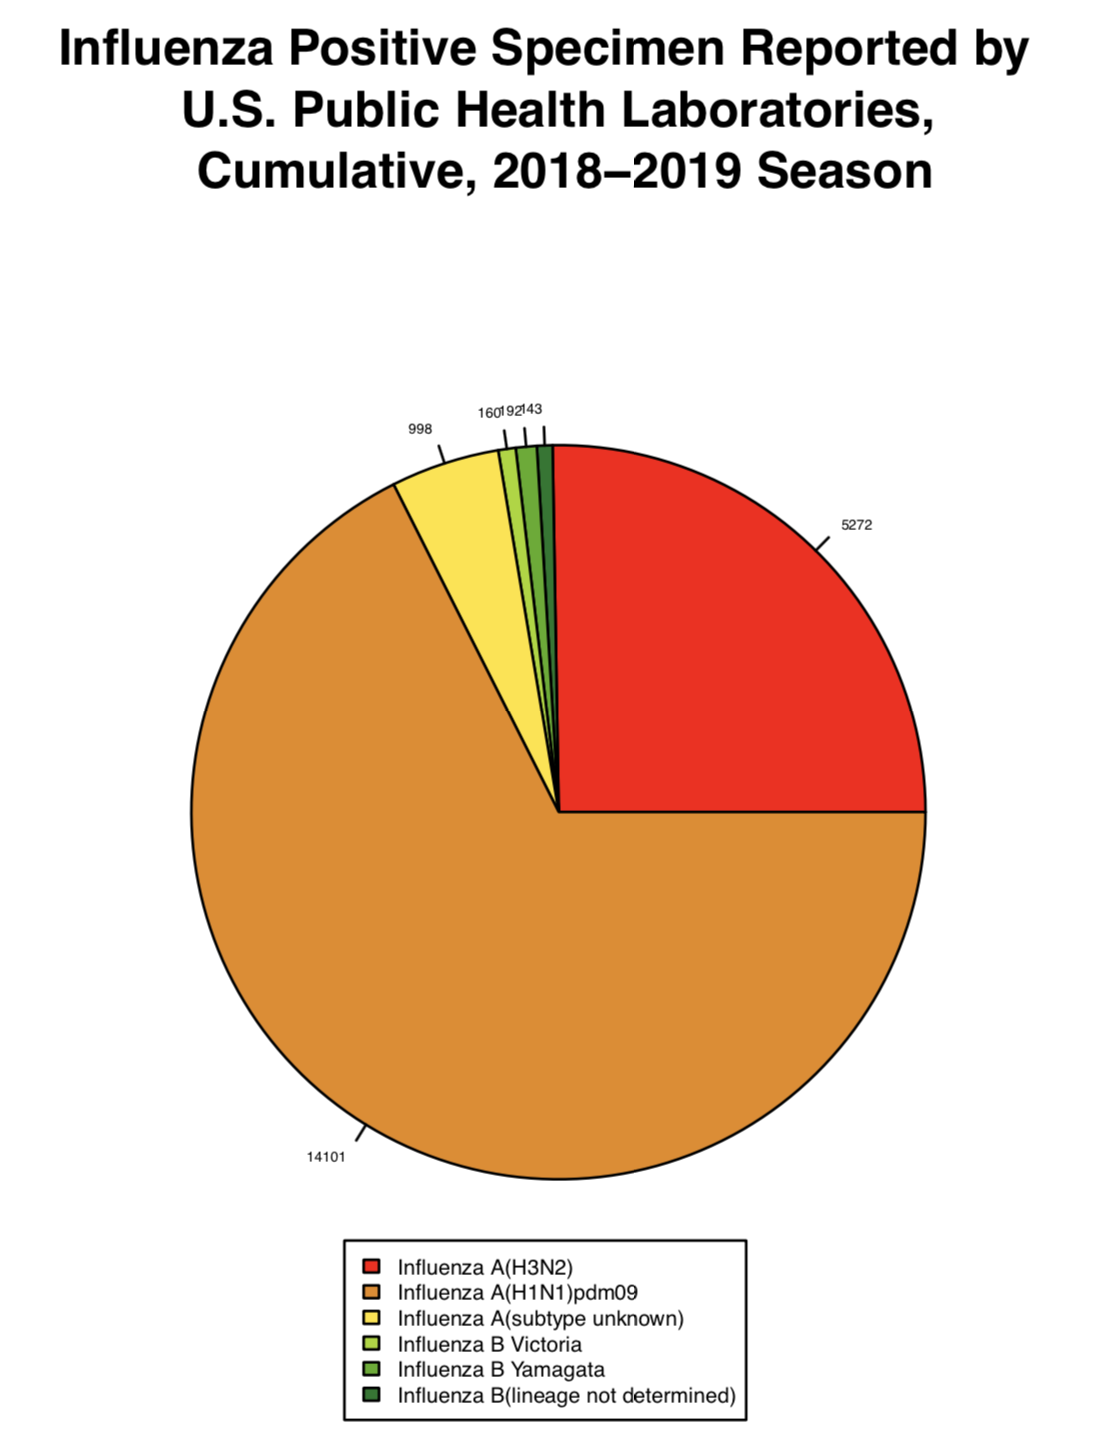
Data Analysis using the data from CDC
Data Analysis on Twitter Data
- Keyword - Flu
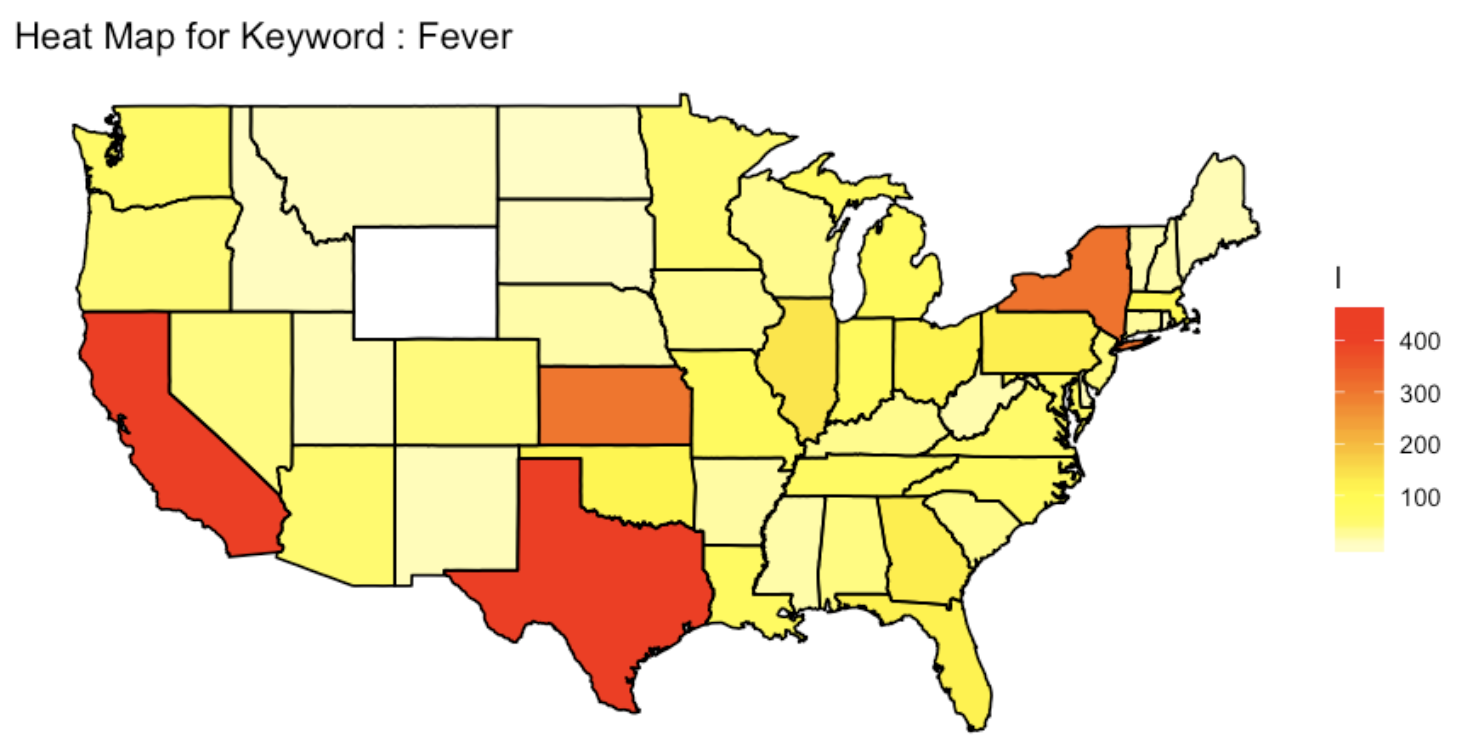
- Keyword - Fever:
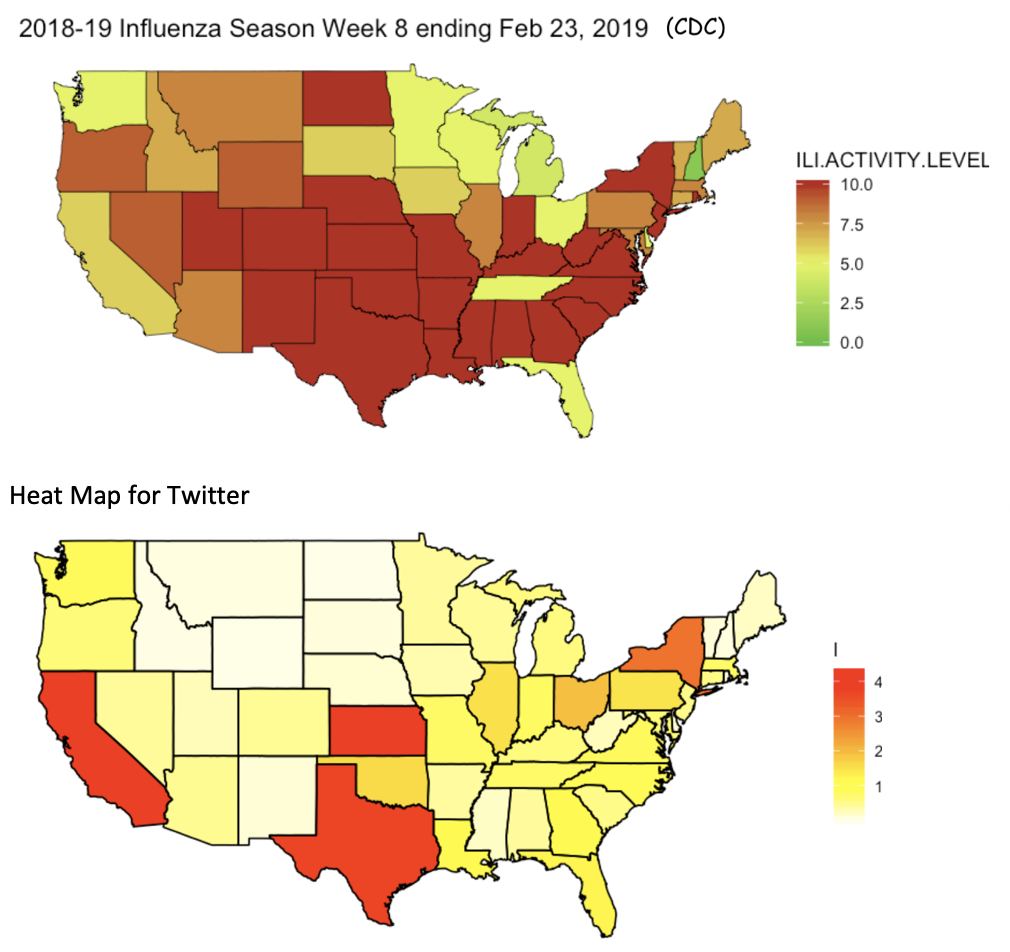
- Comparison with CDC heatmap: